
Which US States Have The Best and Worst Internet?
Internet access is not equal across the US. The type and quality of Internet access varies significantly by location. Some US states enjoy what’s among the fastest and most reliable Internet in the world. However, that’s far from the norm. Over 24 million Americans still don’t have broadband Internet at home.
What states deliver the best Internet experience? What states deliver the worst? Researchers recently took a sweeping look at broadband availability across the entire country. Here’s what they found:
In this article you will find out...
- A Big Picture Look at US Broadband
- General Trends in Internet Speed by State
- Calculating Broadband Speed by State
- What is Broadband Internet?
- Calculating Average Speeds
- A Look at Internet Speed by City
- Potential Issues When Assessing a State’s Internet Speed
- How Do US Internet Speeds Compare to Other Countries?
- Improving Internet Speeds: A Plan for the Future
- Final Thoughts
A Big Picture Look at US Broadband
The average Internet speed across all 50 states is 35.36 Mbps. Speeds in every state fell within 17 Mbps (either higher or lower) of that average.
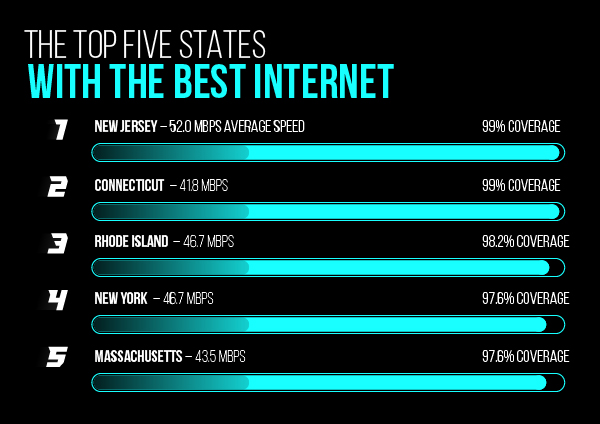
New Jersey has the nation’s best Internet. Broadband covers 99% of the Garden State with an average speed of 52 Mbps.
The top five states with the best Internet are the following:
- #1 New Jersey – 52.0 Mbps Average Speed – 99% Coverage
- #2 Connecticut 41.8 Mbps 99%
- #3 Rhode Island 46.7 Mbps 98.2%
- #4 New York 46.7 Mbps 97.6%
- #5 Massachusetts 43.5 Mbps 97.6%
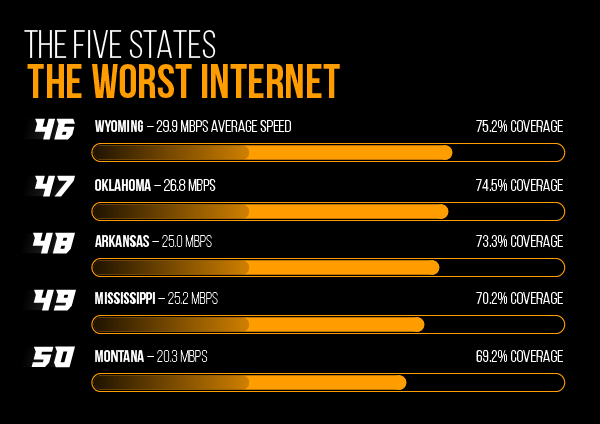
Montana’s Internet is the worst. The state’s average speed is a low 20.3 Mbps with a coverage area of only 69.2%.
The five states with the worst Internet are the following:
- #46 Wyoming – 29.9 Mbps average speed – 75.2% Coverage
- #47 Oklahoma 26.8 Mbps 74.5%
- #48 Arkansas 25.0 Mbps 73.3%
- #49 Mississippi 25.2% Mbps 70.2%
- #50 Montana 20.3 Mbps 69.2%
Here’s a closer look at the remaining states:
- #6 Delaware – 44.9 Mbps average speed – 97.5% Coverage
- #7 Hawaii 22.5 Mbps 96%
- #8 Maryland 51.3 Mbps 96.7%
- #9 California 29.0 Mbps 94.5%
- #10 Florida 41.2 Mbps 94.9%
- #11 Utah 37.2 Mbps 94.9%
- #12 Pennsylvania 41.4 Mbps 94.7%
- #13 New Hampshire 37.4 Mbps 94.3%
- #14 Washington 41.0 Mbps 94.2%
- #15 North Carolina 42.4 Mbps 93.1%
- #16 Ohio 32.1 Mbps 91.9%
- #17 Illinois 40.4 Mbps 92.3%
- #18 North Dakota 28.6 Mbps 92.2%
- #19 Nevada 34.3 Mbps 91.8%
- #20 Georgia 39.1 Mbps 90.6%
- #21 Maine 21.2 Mbps 89.7%
- #22 Virginia 48.7 Mbps 89.9%
- #23 Colorado 40.9 Mbps 90.4%
- #24 Tennessee 36.6 Mbps 89.9%
- #25 Oregon 39.1 Mbps 89.7%
- #26 Michigan 28.7 Mbps 88.3%
- #27 Minnesota 36.8 Mbps 88.1%
- #28 South Carolina 39.3 Mbps 88.2%
- #29 Arizona 33.9 Mbps 86.7%
- #30 Texas 46.9 Mbps 86.9%
- #31 Vermont 22.4 Mbps 86.1%
- #32 Wisconsin 37.5 Mbps 85.3%
- #33 South Dakota 26.8 Mbps 85.3%
- #34 Indiana 36.7 Mbps 85.7%
- #35 Kentucky 30.5 Mbps 85.3%
- #36 Louisiana 35.1 Mbps 84.6%
- #37 Idaho 25.6 Mbps 82%
- #38 Iowa 24.7 Mbps 83.7%
- #39 Nebraska 27.1 Mbps 82.4%
- #40 Kansas 39.9 Mbps 81.9%
- #41 Alabama 33.7 Mbps 81.2%
- #42 Missouri 38.5 Mbps 80.1%
- #43 New Mexico 30.0 Mbps 80.3%
- #44 Alaska 27.9 Mbps 78.2%
- #45 West Virginia 29.9 Mbps 75.2%
General Trends in Internet Speed by State
State rankings make for fun bragging rights if you happen to live somewhere with great Internet. The info can also be useful if you’re looking to move either within your state or to a new one.
However, the major purpose of state rankings is to identify national trends. After studying the numbers, one major trend is clear:
Large, rural states have less Internet coverage and slower speeds than small, highly-populated states.
Montana’s population density is seven people per square mile, while New Jersey has a whopping 1,195 people per square mile.
The Garden State has the highest population density in the US. Plus, it’s relatively small. Covering the entire state with broadband isn’t complicated because it’s basically one large urban area.
However, Montana isn’t the least populated state. It’s ranked 45 out of the 56 states and territories. Why is this important? It shows us that population density plays an important role in broadband access within a state, but it’s not the only factor.
State wealth also plays a role. California is the fourth wealthiest state with the ninth fastest Internet. Washington is the wealthiest with an Internet-speed ranking of 14.
Wealthy states tend to have average-to-high levels of coverage. However, folks living in poor cities are ten times less likely to have broadband Internet at home.
Developing broadband in large, wealthy areas with a high population density will always be the safest investment for Internet providers. That’s true for both large companies like Cox and Xfinity as well as smaller providers such as Google Fiber.
Calculating Broadband Speed by State
Internet marketing agency Akamai recently released a comprehensive State of the Internet Report. They measured average Internet speed in all 50 states plus Washington, DC, and five US territories. Additional research is provided by telecommunications company Windstream Enterprise.
Calculating broadband speeds can be complicated. First, researchers look at data from FCC Form 477, which is a biannual report detailing government records related to broadband coverage. The data in the records is accurate but often incomplete.
Next, researchers compare the FCC data with information from ISPs. Combining information from both sources helps create a complete picture of broadband coverage.
What is Broadband Internet?
Often referred to as high-speed Internet, “broadband Internet” is defined by the FCC as service with minimum speeds of 25 Mbps download and three Mbps upload.
However, they also recognize slower speeds are still effective. They recommend a download speed of at least five Mbps for streaming HD video and four Mbps for online gaming. Additional information is available on the FCC website.
Broadband Internet refers to any high-speed, always-on Internet connection. There are four delivery methods:
- Cable
- DSL
- Fiber optic
- Wireless
Calculating Average Speeds
Researchers collected speed primarily using M-Labs. It’s an open-source speed testing tool run by Google, Princeton University, and others. Researchers also relied on a few other speed test tools to help confirm results.
They divided the speed test results into three categories:
- Service provider
- State
- City
Keep in mind the study looked at the average speed across the entire state. You might live in a state known for slow Internet but personally get blazing fast speeds at home.
Generally, state governments focus on total coverage areas and average Internet speeds. Those two metrics help assess the state’s overall Internet health.
A Look at Internet Speed by City
Individuals should focus on city speeds. For example, Missouri ranks #42 on the list, making their Internet speeds among the country’s slowest. Yet Kansas City is also the home of Google Fiber. If you live in KC, you have access to top Internet speeds. However, those living in rural Missouri often can’t even get broadband, much less FiOS.
If you’re moving to a new location, and want to live somewhere with fast Internet, focus on the speeds available in the cities instead of the state overall.
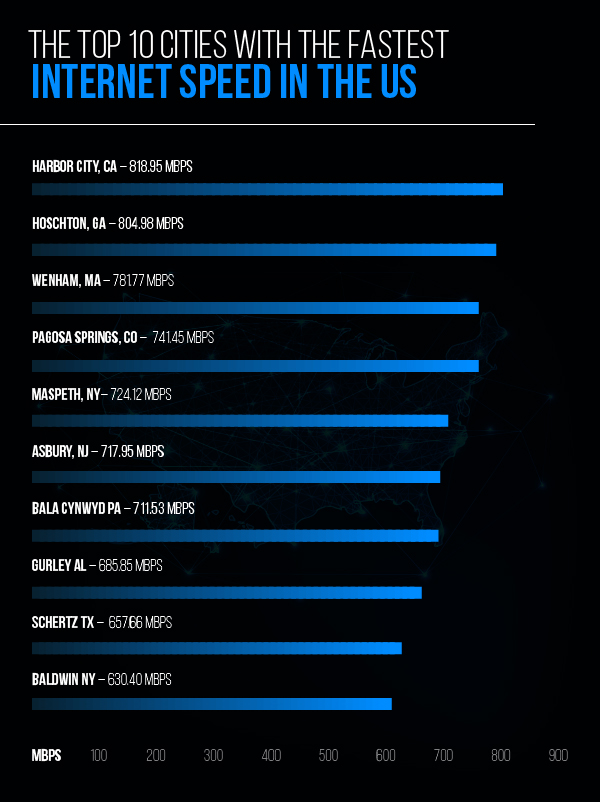
Here’s a closer look at the top 10 cities with the fastest Internet speeds in the US:
- Harbor City, CA 818.95 Mbps
- Hoschton, GA 804.98
- Wenham, MA 781.77
- Pagosa Springs, CO 741.45
- Maspeth, NY 724.12
- Asbury, NJ 717.95
- Bala Cynwyd PA 711.53
- Gurley AL 685.85
- Schertz TX 657.66
- Baldwin NY 630.40
Potential Issues When Assessing a State’s Internet Speed
Two factors often alter the data gathered:
Faulty Tests
If your home Internet isn’t performing as fast as it should, running a speed test is usually one of the first diagnostic steps taken.
Users experiencing faulty routers, modems, or other technical issues conduct far more speed tests than users who are happy with their Internet speeds. So, speed tests often reflect results worse than what you’ll likely experience as long as your equipment remains in proper working condition.
Economy Plans
Most people don’t choose the fastest plans available from their ISP. After all, packages with fast speeds have the highest costs. So-called economy plans are the most popular option across all 50 states. People want to stream and play online games without issues, but they typically don’t want to pay more for top-of-the-line speeds.
City and state speed averages typically skew on the slow side because most users don’t subscribe to the fastest plan possible.
How Do US Internet Speeds Compare to Other Countries?
Sadly, not well. A different study from Akamai ranks the US 10th among world Internet speeds. Tenth place is rather shockingly low considering the country’s size and wealth.
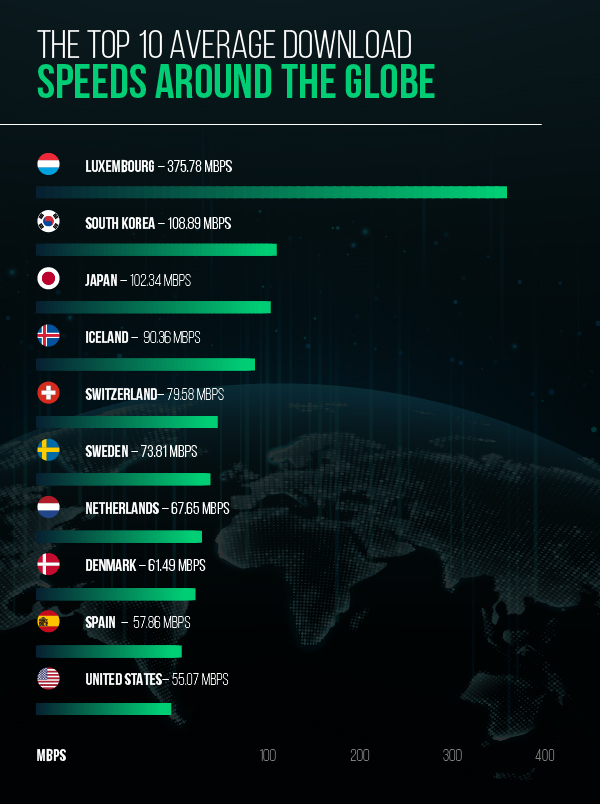
Small but mighty, Luxembourg takes the top spot with an average download speed of 375.78 Mbps. The country’s wealth, small size, and high population density all combine to create ideal Internet conditions. In terms of Internet speeds, Luxembourg is the New Jersey of the world (with no disrespect intended towards either).
Here’s a closer look at the top 10 average download speeds around the globe:
- Luxembourg 375.78 Mbps
- South Korea 108.89 Mbps
- Japan 102.34 Mbps
- Iceland 90.36 Mbps
- Switzerland 79.58 Mbps
- Sweden 73.81 Mbps
- Netherlands 67.65 Mbps
- Denmark 61.49 Mbps
- Spain 57.86 Mbps
- United States 55.07 Mbps
Improving Internet Speeds: A Plan for the Future
Internet coverage and speeds depend on what an ISP is willing to invest in an area. Building complex infrastructure doesn’t always make financial sense, especially in rural areas. Companies don’t want to spend lots of money only to reach a few customers.
Three strategies help incentivize broadband development in rural areas:
- Regulatory incentives allow companies to build infrastructure in rural areas cheaply
- Government grants help cover build costs
- Publicly-funded municipal broadband act as an alternative to commercial ISPs
Another potential option is the creation of a low-orbit satellite mesh. It’s similar to satellite services but significantly less expensive. Low-orbit broadband could reach rural areas without requiring the building of any infrastructure. Although Space-X announced plans for space-based broadband access by 2020, industry experts predict it’ll take much longer to rollout.
Final Thoughts
The quality of the Internet in your state affects far more than your ability to stream shows and play online games. Instead, speeds and coverage impact the economy, employment, education and health of every resident.
Unfortunately, the digital divide grows wider each year. Speeds will almost certainly continue to rise in large cities and suburbs. However, rural regions will likely remain in a digital desert.
The first step towards improving Internet access for all is identifying what areas need help. Although current Internet coverage levels appear grim in many places, improvement is possible. Bringing high-speed Internet to everyone will boost the economy and well-being of the entire country.